SIBR:Linearly Derived Player Ratings
This page or section is being initially created, or is in the process of an expansion or major restructuring. You are welcome to assist in its construction by editing it as well.
Linearly Derived Player Ratings are fan created ratings that attempt to evaluate player attributes by linking them with various performance stats through a linear regression model. Current player ratings can be found at https://astrology-next.vercel.app/.
Linear Regression Model
The model for player evaluation is done through the LINEST function in Microsoft Excel. It uses the performance stat as the y values, then uses applicable player attributes as the x values, then b values and additional regression statistics are set as true. The resulting m values are used to estimate the total correlation that the attributes have against the performance stat. The sum of all the notable slopes is then divided by the individual slopes.
All of the used Excel sheets are linked and can be reviewed below.
Player Ratings
wOBABR
Weighted On-Base Batting Average Batter Rating is calculated by comparing batter attributes and Ground Friction with wOBA, the linear weighted value of all plate appearance outcomes by the batter divided by number of plate appearances. Scaled so league average is league average On Base percentage. This is a combination of all Season 3 through 24 data.
ERPR
Earned Run Pitcher Rating is calculated by comparing pitcher attributes and lineup's average Defense Stars against each games final score, or all runs a pitcher is credited with each game day. Note that this is earned runs, not Earned Run Average. This is a combination of all season 3 through 24 data.
BsRR
Baserunning Runs Rating is calculated by comparing baserunning attributes excluding Ground Friction against BsR/PA, a baserunner performance that is the sum of wSB, wGDP, and UBR (weighted Stolen Bases, weighted Grounded into Double Play, and Ultimate Base Running). This is a combination of all Season 4 through 24 data.
DRiPDR
Defensive Runs implicitly Prevented Defense Rating is calculated by comparing lineup players' defense attributes against DRiP, a sum of baserunning and weighted balls in play run prevention. For players this allocated evenly to each player for each game where they appear.
Retired Ratings
SLGBR
SLuGging Batter Rating is calculated by comparing select batter attributes against SLG, a stat that rates total bases at bat. This was retired in favor of wOBA because the run expectancy is more finely tuned to play conditions than SLG.
Criticisms
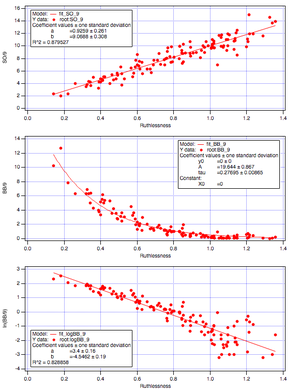
There are multiple points where the linear groupings have room for doubt of their overall utility. On an initial point, it fails to account for various player mods that affect player performance, such as Blood mods, Flinch or Spicy to name only a few. Secondly, the ratings are only as good as the performance stats they are derived from. While efforts have been made to use the most indicative performance stat possible for each rating, there is still room for improvement with the creation of more finely tuned stats. These stats are only made to act as predictors for likely performance and cannot account for simulation changes or changes to the player. The linear growth that these stats use also imply that player's performance consistently trends linearly, but there is evidence that some performance stats trend exponentially, see the chart to the right that shows a linear positive correlation with SO/9, but a exponential negative correlation with BB/9.


