Search results
From Blaseball Wiki
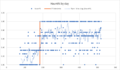
File:Haunt% By Day.png (category Charts & Graphs) Description This chart demonstrates the increase in Inhabiting events involving Haunted players before and after the construction of Ballparks. Source(694 × 407 (47 KB)) - 22:56, 6 January 2022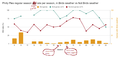
File:Pies winrates bird weather.png (category Charts & Graphs) Description A graph showing the Pies' win rate from Seasons 9 through to 23, in Birds weather versus other types of weather. Source Own work Date 2022-01-07(1,178 × 564 (86 KB)) - 04:51, 7 January 2022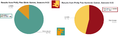
File:Pies winrates bird weather BUT ITS PIE CHARTS GET IT.png (category Charts & Graphs) Description A pair of pie charts comparing Pies' wins in Seasons 9 through to 23, in Birds weather versus other types of weather. Source Own work Date(1,538 × 492 (73 KB)) - 05:02, 7 January 2022


